
GARROW LAKE
Across width of the lake from west toeast near Station A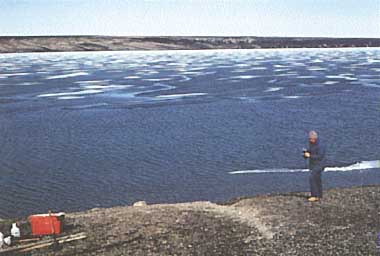
Photo: M.Dickman
A. LOCATION
- North West Territories, Canada.
- 75:23N, 96:50W; 7 m above sea level.
B. DESCRIPTION
- First surveyed in 1974, Garrow Lake lies on Cornwallis
Island, NWT,95 km NNW of Resolute and 3 km from the coast. The lake is
ice-covered for 11 months of the year. It is one of only two arctic lakes
discovered to date which are both permanently stratified (meromictic) and
containing layers of high salinity water (hypersaline). Near the lake surface
the salinity approaches that of freshwater, while it is nearly three times
that of sea water near the bottom. The water is anoxic below 20 m.
The watershed is gently rolling desert tundra overlying Ordovician shale and limestone. A thick glacial drift covers the area and soils are fluvial with smooth slopes and thick regolith, abundant polygons, frost cracks and solifluction structures. There are several small stream valley systems with runoff generally restricted to June-August. Wide-spread fossil shells indicate post-glacial uplift from marine or brackish water during Wisconsin post-glacial period. It is estimated that the lake was established approximately 3,000 years B. P. Lead and zinc deposits are located near the lake.
In November 1981, COMINCO Ltd's Polaris Mine Project began discharging lead and zinc mine tailings into Garrow Lake at a depth of 20 m at the rate over 2,500 metric tons per day, which might irreversibly alter the lake by the impact to its anaerobic bacterial population. This is unfortunate because the anaerobic production of sulfide causes the precipitation of lead and zinc ions from the mine tailings, which, in the absence of sulfide producers, will remain in solution and may eventually find their way into the sea. The sulfide producers also form an essential link in the web of life in Garrow Lake, since the photosynthetic bacteria, the major primary producer in the lake, are dependent on the supply of H2S from anaerobic sulfide producers. To date this major primary producer has all but been eliminated from the lake's chemocline.
The only fish living in the lake is the fourhorn sculpin (Myoxocephalus quadricornis). It is likely that the marine form of this species was trapped in Garrow Lake 3,000 years ago, and has slowly been changing within the lake to adapt to a virtually predator-free system of variable salinity. Chironomids and copepods, the most frequent invertebrates in the lake, are assumed to represent this fish's basic diet. In one sense, Garrow Lake can be viewed as a sort of time capsule offering an ideal area for the study of natural selection and speciation. However, the extirpation of the sculpin is likely to occur over the next decade unless COMINCO changes its mode of discharging toxic mine tailings into this unique body of water (Q, 1-8, 20- 23).
C. PHYSICAL DIMENSIONS (4, 10)
| Surface area [km2] | 4 |
| Volume [km3] | 0.102 |
| Maximum depth [m] | 50 |
| Mean depth [m] | 24.5 |
| Water level | Unregulated |
| Normal range of annual water level fluctuation [m] | <1 |
| Length of shoreline [km] | 10 |
| Residence time [yr]* | |
| Catchment area [km2] | 10.5 |
D. PHYSIOGRAPHIC FEATURES (4)
D1 GEOGRAPHICAL- Bathymetric map: Fig. NAM-50-0l.
- Names of main islands: None.
- Number of outflowing rivesr and channels (name): 1 (unknown).
- Climatic data at Resolute Airport*, 1951-1980 (4a)
| Jan | Feb | Mar | Apr | May | Jun | Jul | Aug | Sep | Oct | Nov | Dec | Ann. | |
|---|---|---|---|---|---|---|---|---|---|---|---|---|---|
| Mean temp. [deg C] | -32.1 | -33.2 | -31.4 | -23.1 | -10.9 | -0.6 | 4.1 | 2.4 | -5.1 | -15.1 | -24.5 | -29.3 | -16.6 |
| Precipitation [mm] | 3 | 3 | 3 | 6 | 8 | 12 | 23 | 31 | 18 | 14 | 6 | 5 | 131 |
- Number of hours of bright sunshine: 1,505 hr yr-1.
- Solar radiation (Alert)[MJ m-2 day-1]
| Jan | Feb | Mar | Apr | May | Jun | Jul | Aug | Sep | Oct | Nov | Dec | Ann. |
|---|---|---|---|---|---|---|---|---|---|---|---|---|
| - | 0.03 | 2.01 | 11.78 | 22.63 | 24.57 | 18.78 | 10.66 | 3.61 | 0.35 | - | - | 10.5 |
Bathymetric map [m](Q).
- Water temperature [deg C]*(4) (1980-1986)
| Depth [m] | Jan | Feb | Mar | Apr | May | Jun | Jul | Aug | Sep | Oct | Nov | Dec |
|---|---|---|---|---|---|---|---|---|---|---|---|---|
| 0 | -0.3 | -0.3 | -0.3 | -0.3 | -0.3 | -0.1 | -0.1 | 3.0 | 2.0 | -0.3 | -0.3 | -0.3 |
| 5 | -0.3 | -0.3 | -0.3 | -0.3 | -0.3 | -0.1 | -0.1 | 2.5 | 2.0 | -0.3 | -0.3 | -0.3 |
| 10 | 0.4 | 0.4 | 0.4 | 0.5 | 0.5 | 0.5 | 3.5 | 4.0 | 4.0 | 2.5 | 0.5 | 0.4 |
| 15 | 5.0 | 5.0 | 5.0 | 5.0 | 5.0 | 5.5 | 6.0 | 6.0 | 5.5 | 5.0 | 5.0 | 5.0 |
| 20 | 8.7 | 8.7 | 8.7 | 8.7 | 8.7 | 8.7 | 8.7 | 8.7 | 8.7 | 8.7 | 8.7 | 8.7 |
| 25 | 8.0 | 8.0 | 8.0 | 8.0 | 8.0 | 8.0 | 8.0 | 8.0 | 9.0 | 8.0 | 8.0 | 8.0 |
| 50 | 7.0 | 7.0 | 7.0 | 7.0 | 7.0 | 7.0 | 7.0 | 7.0 | 7.0 | 7.0 | 7.0 | 7.0 |
- Freezing period
- Mixing type: Meromictic.
- Notes on water mixing and thermocline formation
September-10 Auguast (ca. 1 year). Ice does not clear from the lake on average (4).
Lake permanently stratified throughout the year with a pycnocline at 15-20 m (4). In years when ice out is complete, a thermocline forms between 5 and 15 m (Q).
E. LAKE WATER QUALITY
E1 TRANSPARENCY [m]- Station A, 1980-1986: 10-15 (mean 12 m).
With the exception of spring runoff periods when transparency may decline to 8 m. Transparency also decreases during ice out periods after an inadvertent mine tailing discharge onto surface ice which occurred twice over the 8 years of monitoring (Q).
- Stations A and B, 1984 and 1986
| Depth [m] | Jan | Feb | Mar | Apr | May | Jun | Jul | Aug | Sep | Oct | Nov | Dec |
|---|---|---|---|---|---|---|---|---|---|---|---|---|
| 0 | - | - | - | - | - | - | - | 7.0 | 7.0 | - | - | - |
| 5 | - | - | - | - | - | - | - | 7.0 | 7.0 | - | - | - |
| 10 | - | - | - | - | - | - | - | 7.0 | 7.0 | - | - | - |
| 15 | - | - | - | - | - | - | - | 7.0 | 7.0 | - | - | - |
| 20 | - | - | - | - | - | - | - | 7.1 | 7.1 | - | - | - |
| 25 | - | - | - | - | - | - | - | 7.2 | 7.2 | - | - | - |
| 50 | - | - | - | - | - | - | - | 7.5 | 7.5 | - | - | - |
- Station A, 1981
| Depth [m] | Jan | Feb | Mar | Apr | May | Jun | Jul | Aug | Sep | Oct | Nov | Dec |
|---|---|---|---|---|---|---|---|---|---|---|---|---|
| 0 | - | - | - | - | - | - | - | 2.2 | - | - | - | - |
| 20 | - | - | - | - | - | - | - | 1.8 | - | - | - | - |
| 50 | - | - | - | - | - | - | - | 32.2 | - | - | - | - |
- Oxygen saturation degree [%]
Station A, 1980-1984
| Depth [m] | Jan | Feb | Mar | Apr | May-Jun | Jul-Aug | Sep | Oct | Nov | Dec |
|---|---|---|---|---|---|---|---|---|---|---|
| 0 | - | - | - | - | 100 | 100 | - | - | - | - |
| 5 | - | - | - | - | 100 | 110 | - | - | - | - |
| 10 | - | - | - | - | 120 | 120 | - | - | - | - |
| 15 | - | - | - | - | 60 | 70 | - | - | - | - |
| 20 | - | - | - | - | 0 | 0 | - | - | - | - |
| 25 | - | - | - | - | 0 | 0 | - | - | - | - |
| 50 | - | - | - | - | 0 | 0 | - | - | - | - |
- Carbon concentration
Station B, 1986
| Depth [m] | Total inorganic carbon | Total carbon |
|---|---|---|
| 0 | 15 | 30 |
| 20 | 72 | 130 |
| 40 | 190 | 270 |
| Depth [m] | Jan | Feb | Mar | Apr | May | Jun | Jul | Aug | Sep | Oct | Nov | Dec |
|---|---|---|---|---|---|---|---|---|---|---|---|---|
| 0 | - | - | - | - | - | - | - | 0.3 | 0.2 | - | - | - |
- Total-P [mg l-1]
Station A, 1981
0 m: 0.01.
20 m:0.3.
40 m:1.0.
- Station A, 1981
0 m: 87.
20 m: 51,072.
40 m: 54,264.
Physico-chemical profiles at Station A during 1980 (before discharge of mine tailings) - 1984 (after the discharge)(4).
F. BIOLOGICAL FEATURES
F1 FLORA (18)- All sites, 1980-1986
- Submerged macrophytes
- Phytoplankton
Mosses (Calliergon richardsonii and Drepanocladus brevifolios; abundant near the lake's outlet).
Bacillariophyta (Amphora veneta, A. sp., Anomoeneis serians, Asterionella formosa, Cyclotella comta, C. glomerata, C. kutzingiana, Cymbella cymbiformis, C. minuta, Diploneis interrupta, Fragilaria laponica, Navicula amphibia, N. mutica, N. rhyncocephala, N. spp., Nitzschia frustulum, N. lacuna, N. parvula, Pinnularia major, P. sp., Rhizosolenia longiseta, Stephanodiscus astrea, Surirella striatula, Synedra actinasteroides, Tabellaria fenestrata); Chrysophyta (microflagellates); Chlorophyta (Arthrodesmus incus, Chlamydomonas lapponica, Cosmarium sp., Oocystis parva, Scenedesmus bijuga); Cryptophyta (Cryptomonas spp., Rhodomonas minuta); Cyanophyta (aphanocapsa sp., Gloeococcus schroeteri, Phacomyxa sphagnolia); Pyrrophyta (Glenodinium sp., Gymnodinium helveticum, G. spp., Peridinium deflanderi, P. inconspicum).
- Zooplankton
- Benthos
- Fish: Myoxocephalus quadricornis* (fourhorn sculpin).
Copepods (Limnocalanus macruras (dominant), Onychocamptus mohamedi, Cleocamptus sp. (Herpacticoid copepods)); Cladocerans (Cyclopina sp.).
Chironomids (Orthocladius and Chironomus groups); oligochaetes (Elofsonella concinna, Hemicythere angulata).
* Only one species.
Absorption spectra for acetone extracts of glass filtered samples containing bacteria taken from 20 m depth at Station A before (1980 and 1981) and after discharge of mine tailings (1984 and 1986), showing the decrease of phototrophic bacteria, the major primary producer in Garrow Lake.
G. SOCIO-ECONOMIC CONDITIONS
G1 LAND USE IN THE CATCHMENT AREA (2) (1980)| Area [km2] | [%] | |
|---|---|---|
| Natural landscape Tundra | 8.4 | 80 |
| Agricultural land | 0 | 0 |
| Others | ||
| - Mine tailings and | 2.1 | 20 |
| - mining equipment | ||
| Total | 10.5 | 100 |
- Types of important woody vegetation: Tundra willow and arctic birch.
- Types of important herbaceous vegetation: Arctic saxifrages and poppies.
- Main kinds of crops and/or cropping systems: None.
| Main products or major industries | |
|---|---|
| Primary industry Mining | Lead/Zinc ore concentrate |
- Numbers of domestic animals in the catchment area: None.
- Approximately 150 mine workers and staff employed by COMINCO.
H. LAKE UTILIZATION
H1 LAKE UTILIZATION (4)- Garrow Lake has been receiving mine tailings from the COMINCO Ltd.
Polaris lead and zinc mine since November 1981. Tailings are discharged
to the lake from the xanthate thickener at the rate of approximately 100
metric tons per hour. The ore body is expected to last for 30-40 years
at the present rate of extraction.
| Use rate [m3 sec-1] | |
|---|---|
| Industrial | N.A. |
I. DETERIORATION OF LAKE ENVIRONMENTS AND HAZARDS
I1 ENHANCED SILTATION- Extent of damage: Serious.
- Supplementary notes (Q): Due to the discharge of mine tailings.
- Present status: Little information.
- Supplementary notes (Q)
Analyses of sediments and biota for toxic contaminants have been very limited to date. The disappearance of the photosynthetic bacteria may have been caused by toxic components in the mine tailings or by disruptions in the physiochemical environment, particularly light and ionic gradients. There is the potential for methylation of lead in the anaerobic bottom waters which could enhance the rate of contamination of the biota.
- The lake is ultraoligotrophic. Even though total surface water phosphorus
was 10 ppb (close to the detection limit), it is believed that the elevated
salinity and perhaps the low light intensities after passing through the
2 to 3 m of ice on the lake may result in the observed low algal standing
crop. The fact that phototrophic bacteria at 20 m reach relatively high
population densities indicates that light alone cannot be the entire reason
for the observed low primary productivity.
- Extent of damage: None.
J. WASTEWATER TREATMENTS
J1 GENERATION OF POLLUTANTS IN THE CATCHMENT AREA (Q)- (a) Pristine lake environments.
| [%] | |
|---|---|
| Point sources Industrial | 100 |
- None.
K. IMPROVEMENT WORKS IN THE LAKE (Q)
- None.
M. LEGISLATIVE AND INSTITUTIONAL MEASURES FOR UPGRADING LAKE ENVIRONMENTS (Q)
M1 NATIONAL AND LOCAL LAWS CONCERNED- Names of the laws (the year of legislation)
- Clean Water Act
- Canada Fisheries Act (1972)
- Responsible authorities
- Environment Canada
- Environment Canada, Northern and Western Region, Department of Fisheries and Oceans, Winnipeg, Manitoba
- Supplementary notes
Mining Association of Canada announced a commitment by the mining industry to spend 4 million dollars for a cooperative program of environmental research into the long term management of mine tailings (August, 1988).
- Water Board Hearing Officers, Yellowknife, Northwest Territories
- Science Institute of the Northwest Territories, Yellowknife, Northwest Territories
- Biological Sciences Department, Ontario
- Environment Canada, Department of Fisheries and Oceans, Manitoba
N. SOURCES OF DATA
- Questionnaire filled by Dr. M. Dickman, Brock University, St. Catharines, Ontario, Canada.
- Rigler, F. W. (1978) Polaris Mine Aquatic Environmental Studies. Unpublished Report for COMINCO Ltd. Vancouver, British Columbia.
- Fallis, B. W. & Harbicht, S. M. (1980) A Preliminary Study of the Limnology and Biology of Garrow Lake, N. W. T. Western Region. Department of Fisheries and Oceans, Technical Report. 89 pp. Winnipeg, Manitoba.
- Dickman, M. & Ouellet, M. (1983) Limnological Aspects of Meromictic Lake Garrow. Quebec University (INRS-Eau), Report No. 73.
- --- & --- (1987) Limnology of Garrow Lake, N. W. T., Canada. Polar Record, 23(146): 531-549.
- ) Canadian Climate Normals, 1951-1980. Environment Canada, Atmospheric Environment Service.
- Thorsteinsson, R. (1959) Cornwallis and Little Cornwallis Islands, District of Franklin, Northwest Territories. Geological Survey of Canada, Memoir 294.
- --- & Kerr, J. W. (1968) Cornwallis Island and Adjacent Smaller Islands, Canadian Arctic Archipelago. Geological Survey of Canada, #67-64.
- Research, B. C. (1978) Polaris Mine Aquatic Environmental Studies. Unpublished Report for COMINCO Ltd. Vancouver, British Columbia.
- --- (1981) Polaris Mine Aquatic Studies: 1980 Studies of Garrow Lake and Pullen Strait. Unpublished Report for COMINCO Ltd. Vancouver.
- McAllister, D. E. (1961) The origin and status of the deepwater sculpin, Myoxocephalus thompsonii, a nearctic glacial relict. Bull. Nat. Mus. Can. Contrib. Zool., 172: 44-65.
- Page, P. M., Ouellet, C., Hillaire-Marcel & Dickman, M. (1984) Isotopic analyses (18O, 13C, 14C) of two meromictic lakes in the Canadian arctic archipelago. Limnol. Oceanogr, 79: 554-573.
- ---, Michaud, J., Ouellet, M. & Dickman, M. (1988) Isotopic composition and origin of lacustrine brines in the Arctic. Can. J. Earth Sci., 24: 210-216.
- Ricker, W. E. (1959) The origin of two glacial relict crustaceans in North America as related to Pleistocene glaciation. Can. J. Zool., 37: 871-893.
- Scott, W. B. & Crossman, E. J. (1973) Freshwater Fishes of Canada. Fisheries Research Board of Canada, Bull. 184. 966 pp. Ottawa.
- Ouellet, M. & Page, P. (1988) Canada's most fascinating lake. Geos., 17: 1-7.
- Stewart, K. & Platford, R. F. (1986) Hypersaline gradients in two Canadian high arctic lakes. J. Fish. Aq. Sci., 43: 1795-1803.
- Rigler, F. W. (1978) Limnology in the high arctic: a case study of Char Lake. Verh. Intern. Verein. Limnol., 20: 127-140.
- Drake, J. (1984) Polaris underground and undersea. Orbit., 14: 3-8.
- Dickman, M., Biology, Brock University. Unpublished data.
- Canadian Water Watch (1988) Vol. 1(5), p. 35.
- Duthie, H., Biology Department, University of Waterloo, Ontario. Personal communication.
- Kerr, J. W. (1977) Cornwallis fold belt and the mechanism of basement uplift. Can. J. Earth Sci., 14: 1374-1401.
- --- (1977) Cornwallis lead-zinc district, Missippii Valley-type deposits controlled by stratigraphy and tectonics. Ibid., 14: 1402-1426.
- Andrews, J. T. (1971) Comparison of elevations of archeological sites and calculated sea levels in arctic Canada. Arctica, 24: 210-228.
- Dymond, J. R. (1926) The fishes of Lake Nipigon. Univ. of Toronto Stud. Biol. Ser., 27: 1-108.
- Wetzel, R. G. (1983) Limnology. 767 pp. Univ. Saunders College Publishing, Philadelphia (see p. 180).
